

Sectoral dynamics and the business cycle in the euro area
Prepared by Niccolò Battistini and Johannes Gareis
1 Introduction
Sectoral dynamics are key to understanding the business cycle in two ways. First, sectors are an important source of aggregate fluctuations. For example, an individual sector may experience unexpected changes, or shocks, in its production processes, including severe disruptions to its supply chains. Recent examples of this include the semiconductor shortage that hit the automotive sector or the difficulties the transport sector had in sourcing labour.[1] Second, sectors play a prominent role in the propagation of shocks to overall economic activity. Indeed, different sectors interact through a network of input-output linkages, which in turn connect the primary inputs of production, such as labour and capital, to the final uses of goods and services, such as consumption and investment. Taken together, these interconnections shape the sectoral structure of the economy and affect how different sectors respond to shocks and propagate them to the business cycle.[2]
Recent developments, such as large sectoral shocks and visible changes in long-run trends, have rekindled interest in understanding the implications of sectoral dynamics for economic activity. On the one hand, the exceptional sequence of sectoral shocks observed in recent years – mobility restrictions impeding contact-intensive services, supply bottlenecks disrupting long supply chains for industries and gas price volatility affecting energy-intensive sectors – has revived interest in sectoral dynamics. On the other hand, recent developments in long-run trends, such as the slowdown in globalisation, the acceleration in digitalisation and the progress made towards the green transition may cause changes in the sectoral structure of the economy, warranting a reassessment of the propagation mechanism of shocks.[3]
How can sectoral dynamics inform the near-term assessment of the business cycle? To answer this question, this article examines the main features of recent sectoral developments in the euro area using the decomposition of quarterly real gross value added for eleven sectors provided by Eurostat.[4] This is the best way to measure economic activity at the highest possible level of granularity and frequency in a consistent way across countries.[5] After briefly reviewing the existing literature, the article presents new evidence on the implications of sectoral developments for the near-term outlook of economic activity in the euro area.
2 Existing literature
A large body of literature shows that sectors are important sources of business cycle fluctuations and that their interactions shape the propagation of shocks to the economy. Gabaix argues that idiosyncratic shocks to large firms may explain an important part of aggregate movements in economic activity.[6] Acemoglu, Carvalho, Ozdaglar and Tahbaz-Salehi extend this intuition to an economy with static intersectoral input-output linkages, showing that idiosyncratic shocks in sectors that are important direct and indirect suppliers of other sectors – such as producers of transport goods or service providers of professional activities (e.g. engineering or research and development) – can determine aggregate fluctuations.[7] Baqaee and Fahri, Acemoglu and Azar, and Elliott, Golub and Leduc further enrich this framework with endogenous production networks to show how the complexity of network linkages together with microeconomic structural features determine the propagation of shocks.[8] In their empirical work across advanced economies, Foerster, Sarte and Watson, Atalay, Garin, Pries and Sims, and De Graeve and Schneider provide evidence that sector-specific shocks are the foremost determinants of aggregate fluctuations.[9] In addition, Joya and Rougier, and Caraiani et al. show how the economic impact of sectoral and aggregate shocks depends on the characteristics of the production network.[10]
The existing literature devotes relatively little attention to the predictive power of the sectoral features of the economy for business cycle fluctuations. A large part of the theoretical literature uses static quantitative models of production networks or assumes a complete propagation of shocks within a single period. Furthermore, the empirical literature focuses mostly on the explanatory power of sectoral shocks for overall macroeconomic fluctuations without exploring the dynamics of their propagation. However, recent works by Baqaee, Fahri and Rubbo, based on dynamic models with an incomplete pass-through of shocks through long supply chains, show that shocks ripple through the economy only gradually.[11] Building on their insights, this article investigates to what extent sectoral developments may act as leading indicators for aggregate economic activity.[12]
3 Cross-sectoral shifts in activity and the business cycle
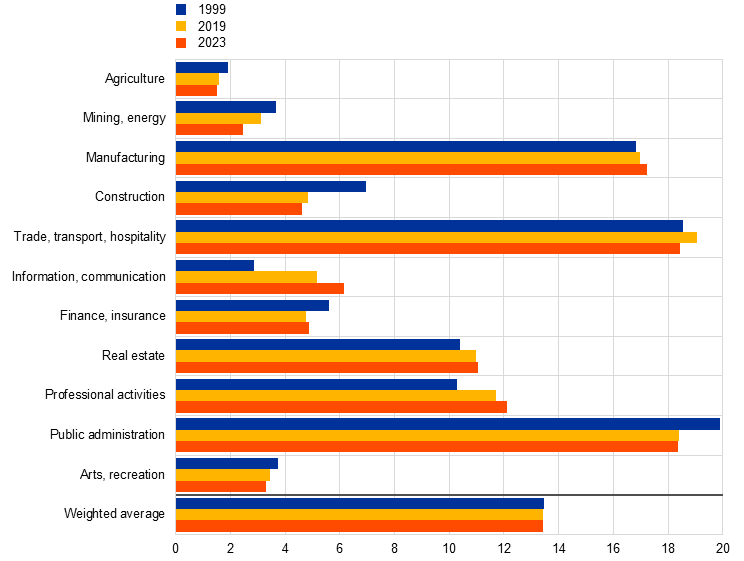
Between 1999 and 2023, the sectoral composition of euro area economic activity remained broadly similar despite episodes of significant shifts in activity across sectors. Looking at the sectoral shares of real gross value added in the euro area in 1999, 2019 and 2023 (Chart 1), the sectoral composition of economic activity in the euro area seems largely stable, as the ranking across sectors by size and the sectoral concentration of activity (measured by the weighted average of sectoral shares) remained broadly the same. Specifically, public administration, trade, transport and hospitality, and manufacturing were still the largest sectors, followed by professional activities and real estate. Over the same period, the composition of activity changed visibly only for relatively small sectors. Some of these exhibited a steady decline, such as construction, due mainly to the contraction in the housing market after the global financial crisis, and mining and energy, especially after the recent energy crisis, while others recorded steady growth, such as information and communication, most notably following the increasing digitalisation of the economy. However, these long-term developments largely overlook short-term shifts in activity across sectors in specific episodes.
Chart 1
Sectoral composition of economic activity in the euro area
(sectoral share; percentages of real gross value added)
Sources: Eurostat, ECB calculations.
Note: The weighted average uses the sectoral shares of real gross value added as weights and it is a synthetic measure for the degree of sectoral concentration of the economy, in the spirit of a Herfindahl-Hirschmann Index (commonly used to gauge market concentration at the firm level) applied to sectoral real gross value added.
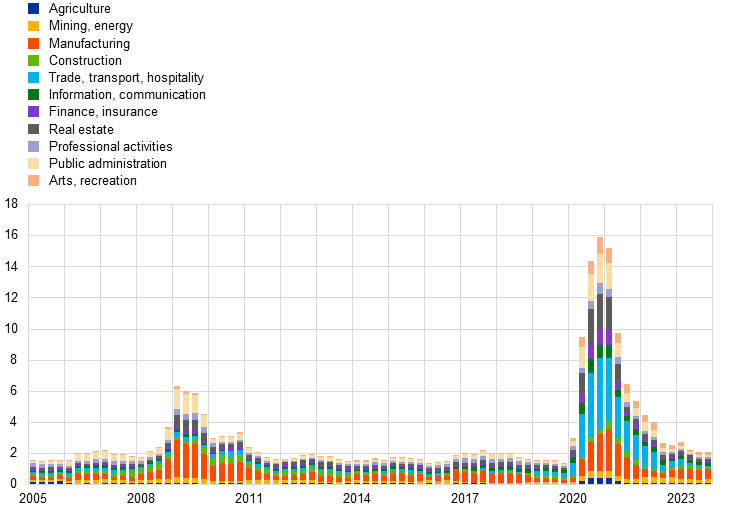
Relatively short-lived episodes of significant shifts in activity across sectors occurred during the two largest euro area recessions. These cross-sectoral shifts in activity can be shown by a simple overall index measuring the aggregate absolute magnitude of changes in sectoral shares at a quarterly frequency, as detailed in Box 1.[13] This overall index of cross-sectoral shifts increases with the magnitude of the changes in sectoral shares, thus indicating a greater reallocation of activity across sectors in the economy. Looking at the evolution of this index between 1999 and 2023 (Chart 2), cross-sectoral shifts increased significantly on two occasions: the first occurred during the global financial crisis and the second during the pandemic crisis.[14] These developments hint at the presence of a clear correlation between large recessions and sizeable reallocations of activity across sectors. Moreover, the index of cross-sectoral shifts provides insights into the magnitude of the recessions, indicating that larger index values are associated with deeper contractions in economic activity. Indeed, in year-on-year terms, the index increased by about 6 percentage points of real gross value added on average in 2009 as real GDP decreased by about 4 per cent, while it gained about 11 percentage points on average in 2020 vis-à-vis a contraction in real GDP of about 6 per cent on average. This correlation between the magnitude of cross-sectoral shifts and the depth of recessions mainly stems from the rebalancing of activity within the services sector that occurred during the pandemic crisis.[15]
Chart 2
Shifts in economic activity across sectors in the euro area
(year-on-year changes and contributions; percentage points of real gross value added)
Sources: Eurostat, ECB calculations.
Notes: The bars represent the absolute value of the year-on-year changes in each sector’s share of total real gross value added. By construction, the actual changes (not in absolute value) across sectors sum to zero at each point in time. The latest observations are for the fourth quarter of 2023.
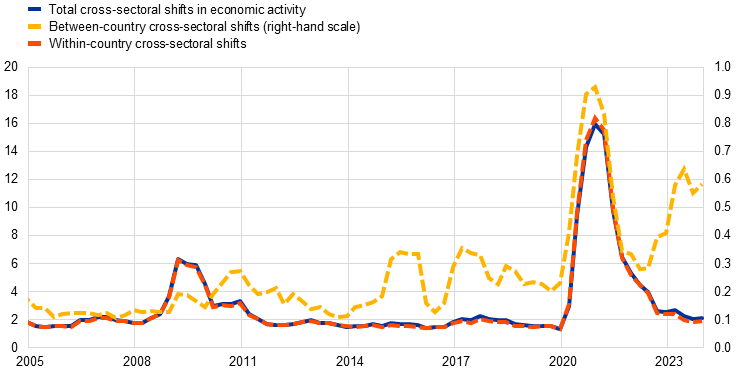
Shifts in activity across sectors reflect a reallocation of activity between and within countries. The overall index of cross-sectoral shifts can be broken down into between-country and within-country indices of cross-sectoral shifts (see Box 1).[16] Looking at the absolute magnitude of cross-sectoral shifts, as in the case of the overall index, the between-country index gauges the reallocation of activity from one country to another assuming unchanged sectoral shares, while the within-country index measures the shifts in activity from one sector to another assuming unchanged country shares.[17] The between-country index may therefore reflect shocks inducing cross-country asymmetries, since these shocks entail a relocation of production processes across countries aimed at making efficiency gains through specialisation and comparative advantage, but which require large adjustment costs and thus typically occur gradually.[18] In contrast, the within-country index may reflect shocks leading to cross-sectoral asymmetries, as these shocks imply changes in the use of factors of production by different sectors, such as hours worked and capital utilisation, which companies may need to implement during a crisis and then unwind as the economy improves. This interpretation appears to be confirmed by the empirical analysis in Box 1, according to which unexpected movements in between-country and within-country cross-sectoral shifts induce persistent positive and negative effects on economic activity respectively.[19] Indeed, the within-country and the between-country indices show significantly different dynamics between 1999 and 2023, indicating their potentially different role in predicting fluctuations in economic activity (Chart 3). While the within-country index largely explains the overall index and is tightly linked to the occurrence of recessions, the between-country index exhibits significantly smaller changes and tends to increase during recoveries, such as between the global financial crisis and the sovereign debt crisis and then again before and after the pandemic crisis, despite a marked increase also during the pandemic crisis, as in the case of the within-country index.[20]
Chart 3
Cross-sectoral shifts in euro area economic activity between and within countries
(year-on-year changes and contributions; percentages and percentage points of real gross value added)
Sources: Eurostat, ECB calculations.
Notes: Between-country cross-sectoral shifts represent the absolute magnitude of year-on-year changes in sectoral shares of real gross value added explained by shifts in activity across countries, conditional on no change in the sectoral composition of economic activity within countries. Within-country cross-sectoral shifts represent the absolute magnitude of year-on-year changes in sectoral shares of real gross value added explained by shifts in activity across sectors in each country, conditional on no change in the country composition of economic activity in the euro area. The latest observations are for the fourth quarter of 2023.
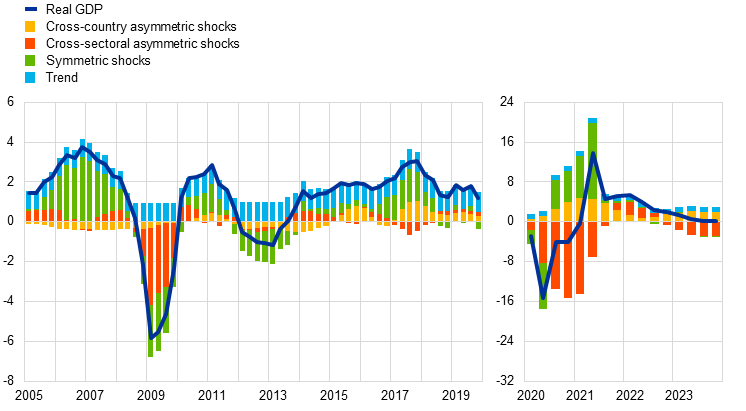
An empirical model shows that the two largest recessions in the euro area were driven mainly by asymmetric shocks across sectors. The empirical model disentangles the contributions of symmetric shocks as well as cross-country and cross-sectoral asymmetric shocks to overall economic activity (see Box 1). To this end, the model assumes that symmetric shocks affect only real GDP on impact, while asymmetric shocks induce changes in both real GDP and cross-sectoral shifts.[21] Importantly, the model allows the data to indicate the direction of the response of real GDP to asymmetric shocks. The model suggests that cross-country and cross-sectoral asymmetric shocks respectively induce lasting positive and negative changes in activity. It thus confirms that cross-sectoral shifts between and within countries are important leading indicators of aggregate activity. Using the model to interpret fluctuations in aggregate activity, the results show that symmetric shocks played a relatively large role over time, especially in the sovereign debt crisis, but cross-sectoral asymmetric shocks explained a significant part of the economic recessions during the global financial crisis and, to a larger extent, the pandemic crisis, suggesting that cross-sectoral (relative to cross-country) dynamics played a prominent role in the euro area business cycle (Chart 4). [22] Looking ahead, it indicates that, as the impact of the pandemic subsides, cross-country and cross-sectoral asymmetric shocks should have a broadly offsetting impact on economic activity, implying an overall moderate momentum in the near term.[23]
Chart 4
Drivers of real GDP in the euro area due to cross-sectoral shifts between and within countries
(year-on-year changes; percentages and percentage points computed as log deviations times 100)
Sources: Eurostat, ECB calculations.
Notes: The chart shows the year-on-year changes in the (log) level of real GDP and the contributions from unexpected movements (shocks) in between-country and within-country cross-sectoral shifts in economic activity in the euro area based on an estimated empirical model. See Box 1 for details on the estimation of the empirical model. The latest observations are for the fourth quarter of 2023.
Box 1
Disentangling the business cycle implications of cross-sectoral shifts in activity between and within countries
Prepared by Niccolò Battistini and Johannes Gareis
This box investigates the changes in the allocation of economic activity across sectors over time and explores how these sectoral dynamics relate to the euro area business cycle. It first explains the methodology used to construct a simple index of sectoral dynamics based on shifts in euro area economic activity across sectors. It then shows how to decompose this index into two components reflecting cross-sectoral shifts between and within euro area countries, suggesting a possible interpretation of their dynamics as being driven by cross-country and cross-sectoral asymmetric shocks respectively. To confirm this interpretation, the box applies an empirical model to estimate the impact of symmetric and (cross-country and cross-sectoral) asymmetric shocks on economic activity.
A simple index can measure the extent of the allocation of economic activity across sectors in the euro area as well as its breakdown between and within countries. The index of sectoral dynamics is computed as the sum of the absolute value of the changes in the sectoral shares of euro area real gross value added across all sectors between two consecutive quarters.[24] Hence, the larger the index, the more pronounced the changes in the sectoral composition of the economy. In turn, each sectoral change can be further broken down into a first component reflecting the change in every country’s share of the euro area economy (conditional on a constant country-specific sectoral share) and a second reflecting the change in every country’s sectoral share (conditional on a constant country share of the euro area economy).[25] In other words, the first and second components reflect cross-sectoral shifts driven by the allocation of activity between and within countries respectively. As discussed in Section 3, the between-country and within-country indices of cross-sectoral shifts exhibit markedly different dynamics, the former being associated mainly with recoveries, the latter with recessions. In turn, these dynamics suggest that these indices can be interpreted as reallocations of activity induced by cross-country and cross-sectoral asymmetric shocks with positive and negative implications for economic activity respectively.
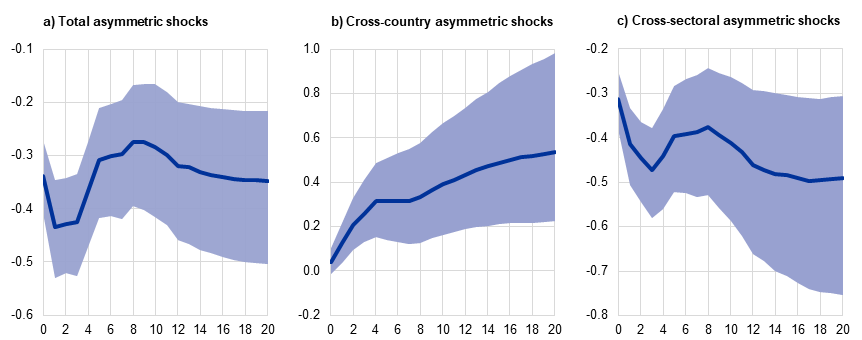
An empirical model shows the different role of cross-country and cross-sectoral asymmetric shocks in driving the euro area business cycle. The model is a structural vector autoregression estimated with Bayesian techniques on aggregate euro area data from the first quarter of 1999 to the fourth quarter of 2023.[26] The baseline version of the model includes the index of total cross-sectoral shifts and real GDP, while the extended version includes the two indices of between-country and within-country cross-sectoral shifts and real GDP. The model teases out the economic impact of symmetric and asymmetric shocks by assuming that positive symmetric shocks raise real GDP and do not imply any change in cross-sectoral shifts, while positive asymmetric shocks increase cross-sectoral shifts and may affect real GDP in either direction. According to the baseline model (Chart A, panel a), total asymmetric shocks reduce real GDP on average by more than 0.3% on impact, about 0.4% at trough and around 0.3% over the medium term.[27] According to the extended model (Chart A, panels b and c), these results mask opposing effects from cross-sectoral asymmetric shocks, which induce a larger negative impact compared with total asymmetric shocks, and cross-country asymmetric shocks, which instead exert persistent and increasing upward pressure on real GDP, reaching almost 0.6% after five years, on average. Hence, these results indicate that shifts in activity across sectors within countries are associated with recessions, while reallocations between countries generate a prolonged increase in activity. Overall, these results suggest that between-country and within-country cross-sectoral shifts have significant implications for business cycle fluctuations over the near term.
Chart A
Average impact of asymmetric shocks on real GDP in the euro area
(x axis: quarters; y axis: percentages, computed as log deviations times 100)
Sources: Eurostat, ECB calculations.
Notes: The charts in panels a, b, and c show the dynamic impact on the log level of real GDP of a unit-standard deviation shock in quarter-on-quarter total, between-country, and within-country shifts in sectoral shares, corresponding to 0.36, 0.04 and 0.32 percentage points of real gross value added respectively. The solid line refers to the median and the shaded areas refer to the 68% credibility bands. The structural vector autoregression model is estimated with Bayesian techniques from the first quarter of 1999 to the fourth quarter of 2023, including twelve lags and a Minnesota prior with a pandemic heteroskedasticity adjustment from the first to the fourth quarter of 2020 (Lenza and Primiceri, op. cit.).
4 Granular sectoral developments and the business cycle
Cross-sectoral shifts, as measured by the overall index mentioned previously, have important implications for the business cycle over the near term, but the dynamics of individual sectors also provide useful information. These granular sectoral dynamics are important because specific characteristics, such as an individual sector’s relative size, volatility or sensitivity to aggregate shocks affect their leading-indicator properties. Moreover, sectors are interconnected through input-output linkages. Changes in activity specific to one sector can therefore have cascading effects on other sectors and become a source of macroeconomic fluctuations, especially if the sector affected by the shock has a central position within the production structure of the economy.
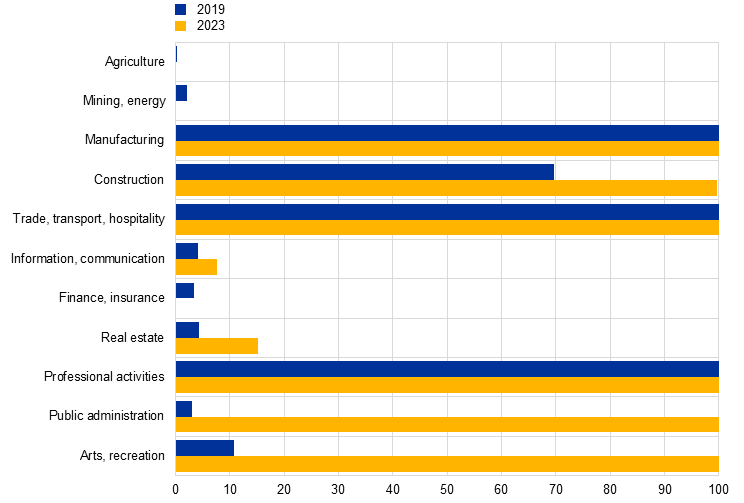
Manufacturing, construction, trade, transport and hospitality as well as professional activities individually act as leading indicators for overall economic activity in the euro area. To gauge the leading-indicator characteristics of activity in the eleven sectors of the euro area economy, a vector autoregressive model assesses whether activity in a sector is helpful for predicting real GDP. The model is based on “Granger causal priority”, which takes into account the indirect effects between economic activity in the different sectors and other macroeconomic variables, and estimates the probabilities that activity in an individual sector predicts real GDP better than vice versa.[28] A high probability means that sectoral activity is very important for predicting real GDP. The results of the model show that manufacturing, trade, transport and hospitality, and professional activities are the best predictors of real GDP for both the pre-pandemic sample and the full sample (Chart 5). In addition, construction activity tends to act as a leading indicator for overall economic activity, while other sectors do not appear to be very relevant. However, for the sample including the post-pandemic period, the estimated probabilities also point towards the importance of public administration and arts and recreation as sectors with leading-indicator characteristics. This result shows that these sectors were subject to strong and symmetric fluctuations in the post-pandemic period, with lasting effects on the overall economy.[29] However, as the effects of the pandemic subside, the leading-indicator role of these sectors is likely to weaken again in the future.
Chart 5
Leading-indicator relation between sectoral activity and real GDP in the euro area
(percentages)
Sources: Eurostat, European Commission, ECB and ECB calculations.
Notes: The chart shows the estimated probability that real GDP is not Granger causally prior to sectoral activity for two samples starting in the first quarter of 1999 and ending in the fourth quarter of 2019 (blue bars) and in the fourth quarter of 2023 (yellow bars) respectively. The empirical model follows Jarociński and Maćkowiak (see footnote 28). In addition to euro area real GDP and real gross value added in the eleven sectors, the HICP, 3-month Euribor, oil prices, effective euro exchange rate and economic sentiment measured by the European Commission survey are also included in the model. All variables are entered in the model in log levels, except for interest rates and economic sentiment, which are entered in levels.
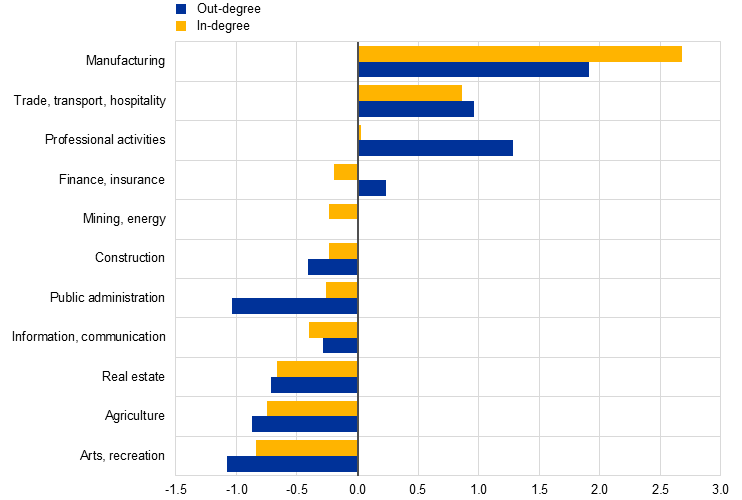
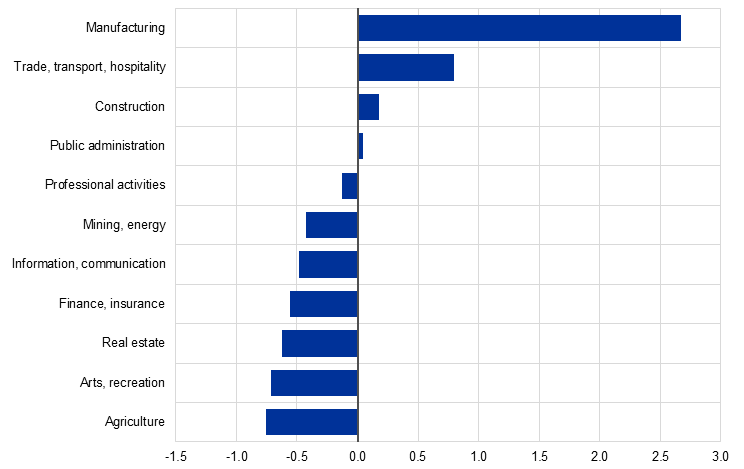
The sectors of the euro area economy vary considerably in terms of their position within the production structure. Intuitively, the leading-indicator property of a sector is linked to its “centrality” within the economy, namely whether a sector occupies a central position in the economy’s production network and can therefore be an important source or propagator of shocks. This centrality can be measured using input-output tables in different ways. First-order centrality measures the direct links of a sector as a provider or user of inputs to or from other sectors. Second-order centrality gauges the direct and indirect links across the entire network of sectors. According to the second-order centrality, a sector can therefore also be central if it has few links with other important sectors. Computations based on Eurostat’s FIGARO input-output tables show that the most central sector of the euro area economy according to both first-order and second-order centrality is manufacturing (Chart 6, panels a and b).[30] In addition to the manufacturing sector, trade, transport and hospitality also have a relatively high first and second-order centrality. Construction, on the other hand, has relatively few direct links to other sectors based on first-order out-degree and in-degree centrality (hence, low first-order centrality) but is a very central sector based on second-order centrality because it is linked to other important sectors, such as manufacturing. The least central sectors within the production structure of the euro area economy are agriculture and arts and recreation, both in terms of first-order centrality and second-order centrality.
Chart 6
Position of sectors in the production structure of the euro area economy
a) First-order centrality
(standard deviation)
b) Second-order centrality
(standard deviation)
Sources: FIGARO and ECB calculations.
Notes: The chart shows standardised values with mean zero and a standard deviation of one for the average values for first-order and second-order centrality for the available data from 2010 to 2021. First-order centrality is measured in terms of in-degree and out-degree, while second-order centrality is measured by PageRank centrality. The sectors are sorted according to the degree of centrality, with the sector with the highest centrality coming first. In panel a, this order refers to the in-degree.
A formal test confirms that the leading-indicator characteristics of manufacturing, construction, trade, transport and hospitality and of professional activities are linked to these sectors’ central position within the euro area economy. To formally check whether centrality can explain the relevance of sectoral activity for predicting real GDP, a cross-sectional regression is performed for the ten largest euro area countries, relating the leading-indicator characteristic of a sector to its various centrality measures and taking into account the relative size and volatility of a sector.[31] The results show that, for the pre-pandemic sample, the different centrality measures are positively and statistically significantly associated with the leading-indicator characteristic of a sector, while size and volatility do not seem to matter (Table 1, columns 1, 2 and 3). Indeed, while manufacturing and trade, transport and hospitality each have a relatively large share of total economic activity across the euro area, the share of construction is relatively small. In the sample covering the post-pandemic period, the first-order measures are not significant, while the second-order centrality remains significant, and size becomes statistically relevant in explaining the leading-indicator characteristics across sectors (Table 1, columns 4, 5 and 6). The latter result is explained by public administration, which is quite large and emerged as a sector with leading-indicator characteristics in the sample including the post-pandemic period.
Table 1
Determinants of the leading-indicator properties of a sector
(coefficient estimates and standard errors (in parenthesis); dependent variable: Granger causal priority probabilities)
1999-2019 |
1999-2023 |
||||||
|---|---|---|---|---|---|---|---|
1 |
2 |
3 |
4 |
5 |
6 |
||
First-order centrality |
In-degree |
0.14∗∗∗ |
0.05 |
||||
(0.004) |
(0.053) |
||||||
First-order centrality |
Out-degree |
0.11∗∗∗ |
0.02 |
||||
(0.034) |
(0.042) |
||||||
Second-order centrality |
PageRank |
0.19∗∗∗ |
0.13∗∗ |
||||
(0.044) |
(0.057) |
||||||
Size |
-0.00 |
0.01 |
-0.01 |
0.028∗∗∗ |
0.03∗∗∗ |
0.01∗∗ |
|
(0.007) |
(0.005) |
(0.001) |
(0.008) |
(0.006) |
(0.009) |
||
Volatility |
-0.06 |
-0.05 |
-0.07 |
0.04 |
0.06 |
0.02 |
|
(0.032) |
(0.031) |
(0.030) |
(0.054) |
(0.052) |
(0.054) |
||
Total observations |
110 |
110 |
110 |
110 |
110 |
110 |
|
R-squared |
0.20 |
0.20 |
0.25 |
0.25 |
0.25 |
0.28 |
|
Sources: Eurostat, FIGARO, European Commission, ECB and ECB staff calculations.
Notes: The table presents cross-sectional regressions for the ten largest euro area member countries. The dependent variable is the Granger causal priority probability of a sector in each country. The first-order out-degree and in-degree centrality measures the importance of the producers of inputs for other sectors and the users of inputs from other sectors respectively, while PageRank centrality takes into account the direct sectoral inflows and outflows as well as the indirect links across the entire network of sectors. The size of a sector is measured by the share of sectoral real gross value added and the volatility by the standard deviation of the annual growth rate of a sector’s real gross value added relative to total real gross value added, on average, over the corresponding sample. Ordinary standard errors in parentheses: *** p<0.01, ** p<0.05, * p<0.1, where the p-value denotes the significance of the estimated coefficient. R-squared refers to McFadden's pseudo R-squared and indicates the relative explanatory power of the regressions.
The recent developments in economic activity in manufacturing, construction, trade, transport and hospitality as well as in professional activities point to moderate momentum for euro area real GDP in the near term. The (unweighted) average of the year-on-year changes in real gross value added for manufacturing, construction, trade, transport and hospitality as well as for professional activities generally appears to act as a leading indicator for developments in economic activity in the other sectors (Chart 7).[32] This underlines that activity in these sectors, which include both manufacturing and some market services, is more relevant for predicting overall economic activity than activity in the other sectors. In terms of recent economic developments, momentum in the sectors with leading-indicator properties declined in 2023, while it held steady in the other sectors, driven mostly by buoyant activity in information and communication, and in arts and recreation. Although activity in information and communication may continue to grow owing to the increase in digitalisation, activity in arts and recreation may be held back due to the dissipation of reopening effects. Together with weakening activity in the sectors with leading-indicator properties, these developments suggest moderate momentum in the overall economy over the near term in line with the signals from the cross-sectoral shifts in activity (Section 3).
Chart 7
Developments in sectors with leading-indicator properties and other sectors in the euro area
(year-on-year changes, percentages)
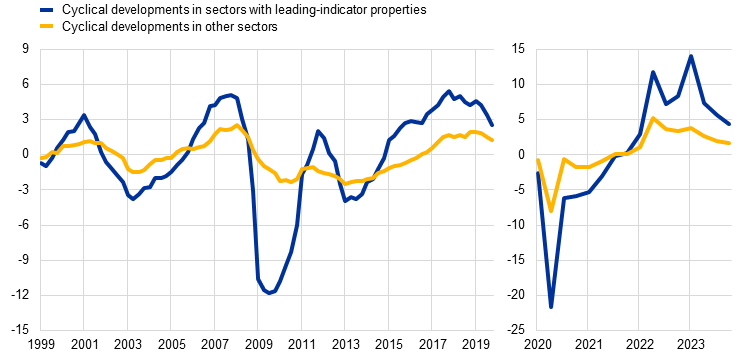
Sources: Eurostat and ECB calculations.
Notes: The chart shows the (unweighted) average of the year-on-year percentage changes for real gross value added in the sectors with leading-indicator properties (manufacturing, construction, trade, transport and hospitality as well as professional activities) and the other sectors in the euro area economy. The latest observations are for the fourth quarter of 2023.
5 Conclusion
The article provides model-based evidence that cross-sectoral shifts in activity can act as leading indicators for aggregate economic activity. Moreover, it shows that the overall index of cross-sectoral shifts – as measured by the sum of absolute changes in sectoral shares – masks opposing effects from shifts in activity between countries owing to the gradual relocation of production processes aimed at efficiency gains across countries, and within countries, reflecting detrimental changes in the use of resources across sectors. Based on model evidence, the article shows that between-country shifts anticipate lasting growth dynamics, while within-country shifts precede economic recessions.
The article further identifies four sectors with leading-indicator properties for aggregate activity, namely manufacturing, construction, trade, transport and hospitality, as well as professional activities. It then examines the position of sectors in the production structure of the euro area economy on the basis of their centrality, which measures a sector’s importance in the economy in terms of its influence on other sectors; it then relates this centrality to a sector’s usefulness for predicting real GDP. The article finds that the centrality of a sector, especially its second-order centrality, which measures its influence through direct and indirect effects within the economy’s production structure, explains its predictive power with respect to economic activity.
Overall, the article underlines the importance of monitoring and analysing sectoral developments. It argues that examining cross-sectoral shifts from an aggregate perspective as well as individual sectoral developments from a granular perspective provides a comprehensive understanding of the economy and enables more effective policymaking. In fact, a thorough sectoral analysis helps to understand how shocks originate and propagate throughout the economy, which is crucial for assessing their potential magnitude and cascading effects. Ultimately, monitoring and analysing sectoral developments enables policymakers to anticipate and mitigate potential risks to the economy by adjusting their policy responses.
EIN Presswire does not exercise editorial control over third-party content provided, uploaded, published, or distributed by users of EIN Presswire. We are a distributor, not a publisher, of 3rd party content. Such content may contain the views, opinions, statements, offers, and other material of the respective users, suppliers, participants, or authors.