
This analysis accompanies Metro Monitor 2025, a data interactive that provides decisionmakers in the nation’s 195 largest metro areas with a roadmap to understand how their individual places performed during this period.
In one of his first moves after securing a second term, President Donald Trump signed an executive order titled “Delivering Emergency Price Relief for American Families and Defeating the Cost-of-Living Crisis.” While light on policy specifics, the order was a clear attempt to deliver on a core campaign pledge to “make America affordable again.”
Despite a steady decline in inflation since mid-2022 (briefly interrupted by an unexpected uptick in January), affordability remains a pressing concern for American workers. A 2024 Gallup poll found inflation and housing costs topped voters’ worries—a sentiment that played a decisive role in last November’s general election results. Now, President Trump faces the challenge of turning campaign promises into economic relief.
Notwithstanding the importance of federal action, the dynamics that ultimately shape affordability largely operate at the local level. The pace of population growth, the rate and distribution of job creation and income gains, and the supply and demand of key amenities—especially housing—all vary considerably across the nation’s diverse regional landscape. Therefore, examining economic performance and cost-of-living trends at the regional scale may help policymakers understand how their actions can better balance wages and prices for workers and families.
Against this backdrop, our 2025 update to Brookings’ Metro Monitor takes a fresh look at economic performance and affordability over the past decade. Using 15 indicators to measure economic performance (see text box below) and the Bureau of Economic Analysis’ relative price parity index (RPP) to measure affordability, this analysis explores the following questions across the nation’s 195 largest metro areas:
- How has affordability shaped regional economic growth and prosperity?
- How have regional economic growth and prosperity influenced affordability and inclusion?
- Can metro areas achieve economic growth and prosperity while preserving affordability?
Related Content
What is the Metro Monitor?
The Metro Monitor is Brookings Metro’s comprehensive tracker of economic growth in regional economies across the U.S. with populations greater than 250,000. We group metro areas into three size categories: 54 “very large” metro areas with populations over 1 million; 56 “large” metro areas with populations between 500,000 and 1 million; and 85 “midsized” metro areas with populations between 250,000 and 500,000. We also group metro areas across the Bureau of Economic Analysis’ eight economic regions to explore geographic trends. This tool tracks economic progress across 15 indicators of growth, prosperity, and inclusion. This year’s Metro Monitor evaluates how regional economies have changed between 2013 and 2023 on the following indicators:
| Growth | Prosperity | Overall inclusion | Racial inclusion | Geographic inclusion |
| Real GDP | Average wages | Employment rate | Employment gap, white vs. POC | Neighborhood employment gap |
| Total employment | Productivity | Median earnings | Earnings gap, white vs. POC | Neighborhood earnings gap |
| Jobs at young firms | Standard of living | Relative poverty | Poverty gap, white vs. POC | Neighborhood poverty gap |
Metro areas that were moderately affordable in 2013 registered the fastest economic growth over the succeeding decade
To explore the dynamics of affordability, we grouped the nation’s 195 metro areas with over 250,000 residents into five equal categories based on their 2013 RPP index, ranging from least affordable to most affordable. In general, the nation’s most affordable metro areas were concentrated in the Midwest and South in 2013, while regions on the coasts were the least affordable.
Between 2013 and 2023, economic growth—as measured by regional growth in gross domestic product (GDP), jobs, and employment in young firms—was fastest in the “moderately affordable” metro areas that fell between the two extremes (Figure 1). These moderately affordable, high-growth metro areas are concentrated in Southern states such as Florida and Texas, and throughout the Rocky Mountains and far West. Metro areas such as Nashville, Tenn. and Provo-Orem, Utah exemplify this trend. These metro areas were not as expensive as those in California or the Northeast in 2013, nor were they the cheapest regions in the Midwest and South that were experiencing significant economic stagnation and population decline. They offered increasing numbers of high-paying white collar jobs historically concentrated in the most expensive metro areas, but at a lower cost of living.
Despite their relatively low growth trajectories, the most expensive metro areas experienced higher increases in overall prosperity than their more affordable peers—revealing differences in how prosperity growth was driven nationwide (Figure 1). As costs of living have soared in large coastal regions such as New York and San Francisco, workers have been fleeing elsewhere—either for new job opportunities, or to work remotely in more affordable housing markets, which has driven up average earnings per worker and the ratio between each region’s GDP and their employment/population base. As a result of this out-migration, the nation’s most expensive metro areas experienced far more tepid prime-aged population growth than their middle- and higher-cost peers before the pandemic, and have actively lost prime-aged population in each year following 2020.
Notwithstanding the gains in moderately affordable regions and the challenges in the highest-cost metro areas, it would be overly simplistic to conclude that lower affordability drives higher growth. The nation’s “lowest-cost” metro areas performed worst on all metrics of growth and prosperity and experienced significantly lower prime-aged population growth than their middle- and higher-cost peers. For these regions—most concentrated in the industrial Midwest and South—low costs are often a byproduct of other conditions that dampen economic growth, such as industry decline, decaying physical infrastructure, stark racial and spatial segregation, and other challenges of economic distress.
Rapid growth led to higher increases in relative costs of living for most metro areas
Rapid growth comes with a price—and for America’s fastest-growing metro areas, that price is increased housing costs. Of the 82 “high-growth” metro areas shown in Figure 2, 64 (78%) experienced increases in their relative cost of housing between 2013 and 2023. This decline in affordability was most pronounced in middle- and higher-cost metro areas such as Olympia, Wash., and Cape Coral, Fla., which experienced significant population and employment growth in the 2010s but were unable to increase their supply of housing enough to keep up with demand. As a result, many of these high-growth metro areas are now among the least affordable housing markets in the United States.
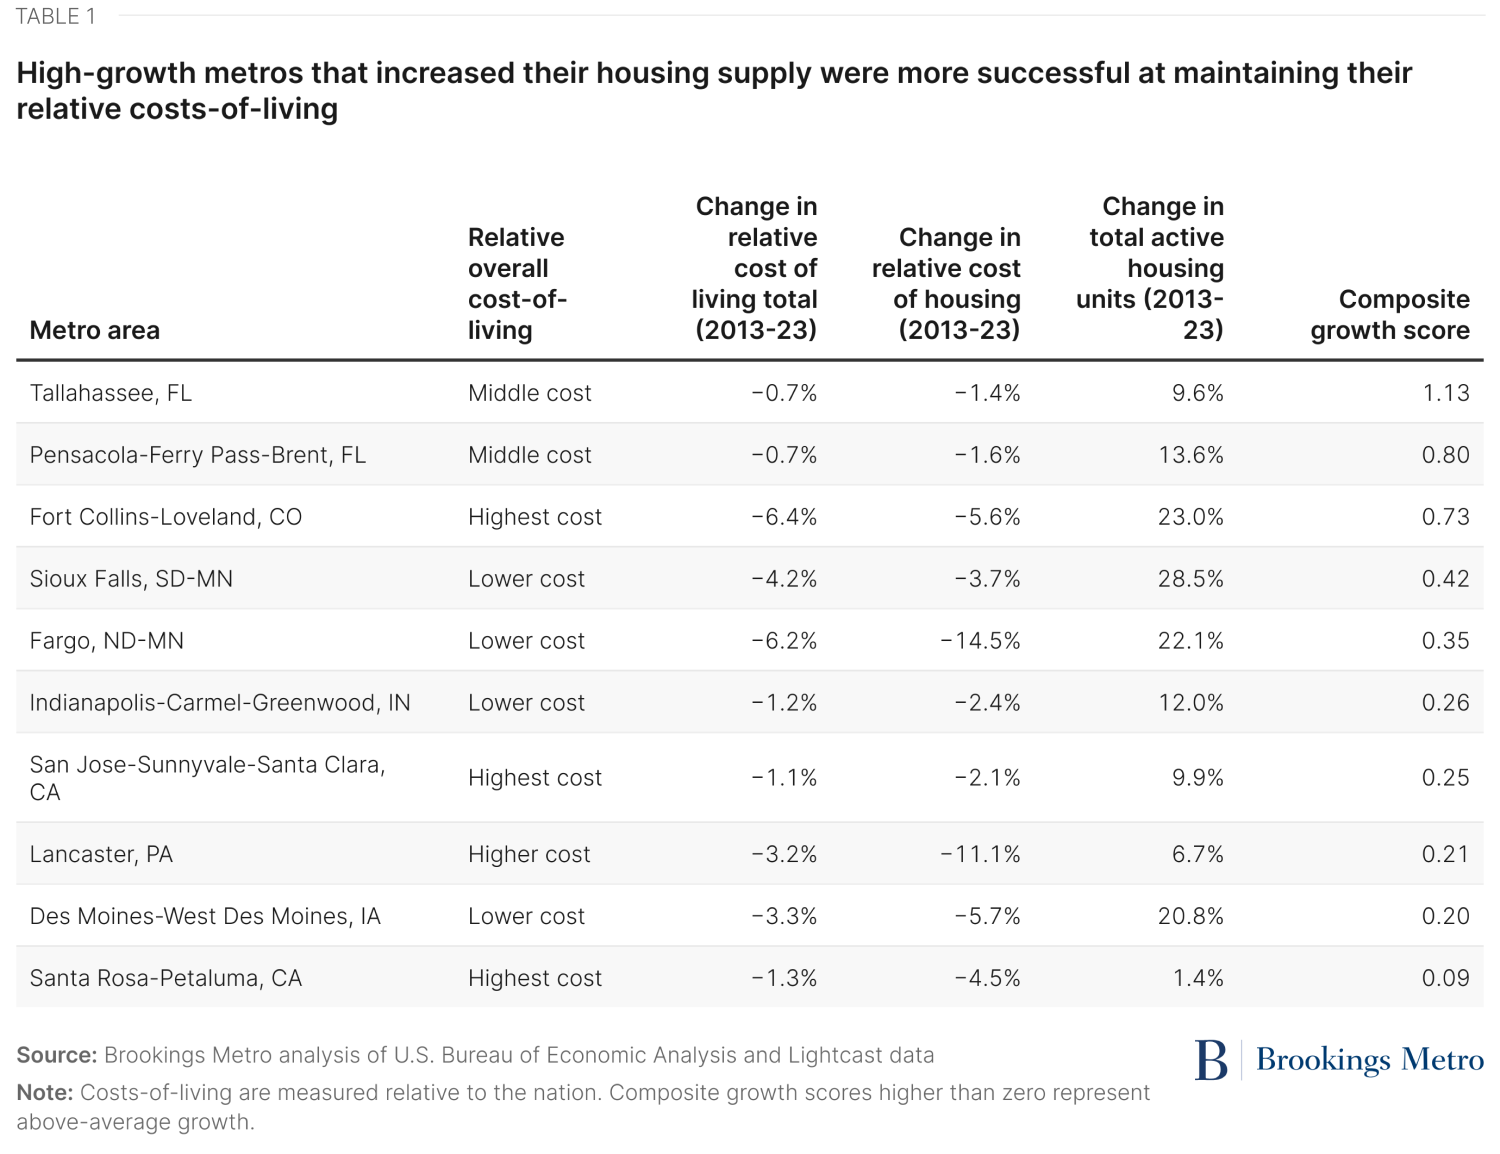
Achieving strong growth without losing control of living costs proves difficult, but not impossible. Our analysis reveals that of the nation’s 195 largest metropolitan areas, 10 were able to achieve strong growth and prosperity between 2013 and 2023 while maintaining relatively low increases in the cost of living (both overall and for housing, compared to the nation writ large). While these metro areas are all quite different from one another, they share two key similarities. First, all 10 metro areas have increased their housing supply since 2013. Second, they have increased their housing supply at a rate faster than their population growth—ensuring that their workers are not competing in a housing market that cannot keep up with demand. Housing supply becomes a critical input to achieving quality economic growth while not exacerbating the cost of living.
Median earnings growth was relatively consistent across metro areas, despite differences in costs of living
The tradeoff between growth and affordability can be measured most clearly through the change in “real” median earnings—a key metric of economic inclusion that adjusts the median worker’s wage gains for increases in local cost of living. While jobs in highly expensive metro areas do tend to pay higher wages than jobs in more affordable regions, these higher wages do not always lead to greater purchasing power. Figure 3 shows that after adjusting for regional price parity, increases in real earnings for the median worker are remarkably consistent across metro affordability categories. So even though these metro areas experienced very different growth trajectories, the increases in cost of living meant that the median worker’s real wage growth was essentially the same, whether in Denver or Dayton, Ohio.
Creating a more prosperous America requires finding a balance between growth and affordability. Our analysis highlights that this balance is rare but achievable. Regions that can create dynamic environments for industries and workers are growing, and those that use state and local tools to enable housing supply to keep pace with growth can preserve affordability and thereby help lower- and middle-income earners get ahead. Moving forward, policymakers must prioritize strategies that promote both growth and affordability—ensuring that prosperity is widely shared and not undermined by rising living costs.
Authors


The Brookings Institution is committed to quality, independence, and impact.
We are supported by a diverse array of funders. In line with our values and policies, each Brookings publication represents the sole views of its author(s).