Well, that was fun. From panic to euphoria in less than 24 hours. A little manic? Perhaps.
Ok, maybe it wasn’t euphoric yesterday, but surely it wasn’t anywhere close to what the futures were indicating last night. Maybe the ADP Jobs report helped a bit there. I think the report paints a positive picture for Friday’s BLS job report.
Additionally, President Trump’s announcement on Iran surely helped to calm fears too.
S&P 500 (SPY)
It is kind of amazing that the S&P 500 Futures touched 3,180 Tuesday night at 7:30 PM, only to reach 3,267 by 3:15 PM yesterday. That’s only a 2.65% reversal off the lows.
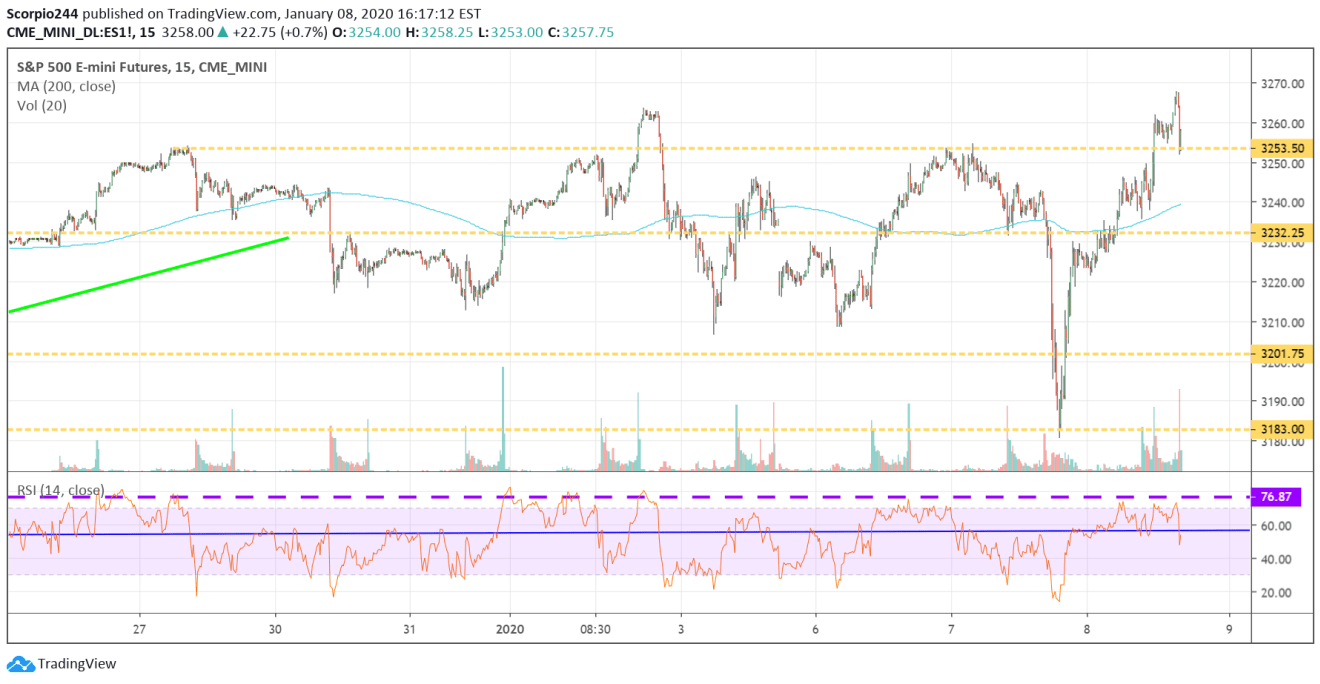
The goods news here is the futures took out resistance at 3,253, and the previous highs around 3,260. It does suggest that the S&P 500 continues higher.
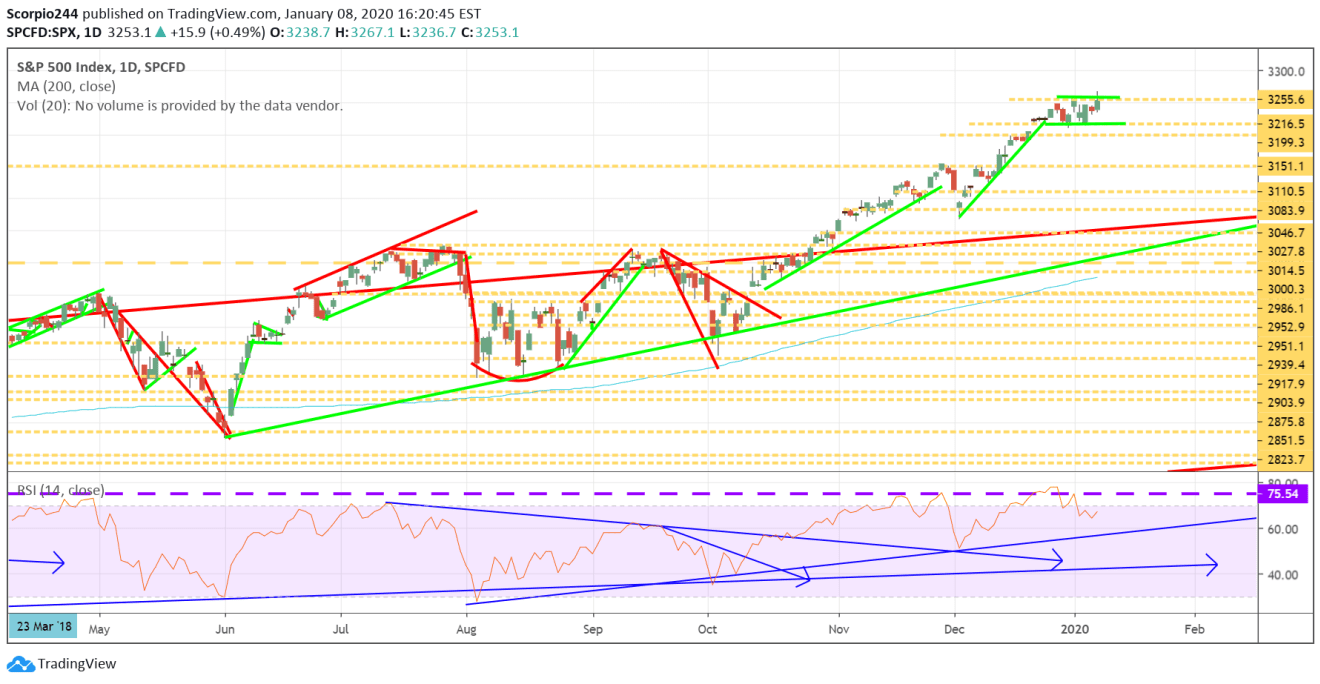
Additionally, the pattern in the cash market would also suggest that higher prices are coming, despite not officially breaking out yesterday. It seems to me based on the chart that a flag pattern has formed, and it suggests higher stock prices lay ahead for the index, if not today, then Friday.
Energy (XLE)
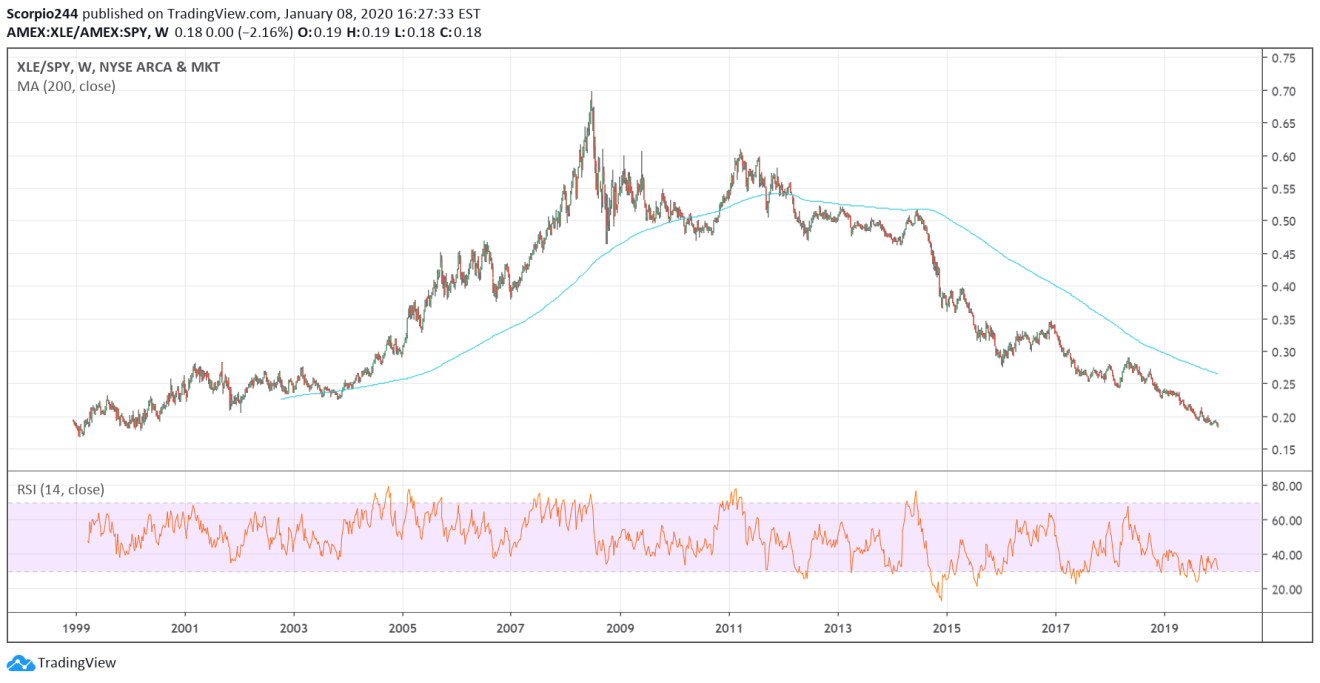
One has to wonder what has happened to the energy sector. If it can’t rally on rising oil prices, then what is going to be a catalyst for the group? It is worth noting that the XLE (NYSE:XLE) ETF is trading at levels not seen since the year 2000 relative to the SPY (NYSE:SPY). It is nearly at its lowest point ever. It is trading as if it is a dying asset class, perhaps it is.
Tesla (TSLA)
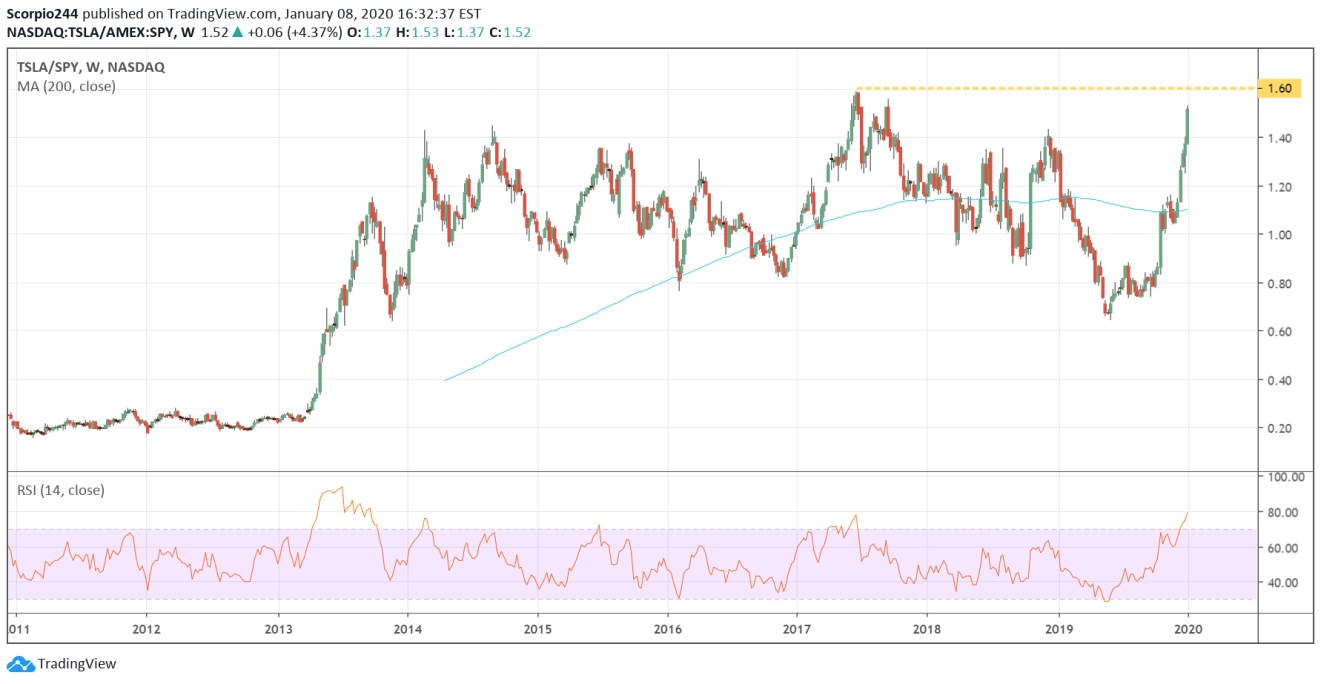
Anyway, if you want a mind-blogging chart. Look at this one of Tesla (NASDAQ:TSLA) relative to the S&P 500 ETF. What is interesting here is that Tesla isn’t even at its highest levels relative to the S&P 500, which was in June 2017. It is almost as if the stock is trying to play a giant game of catch up for all those years of underperformance.
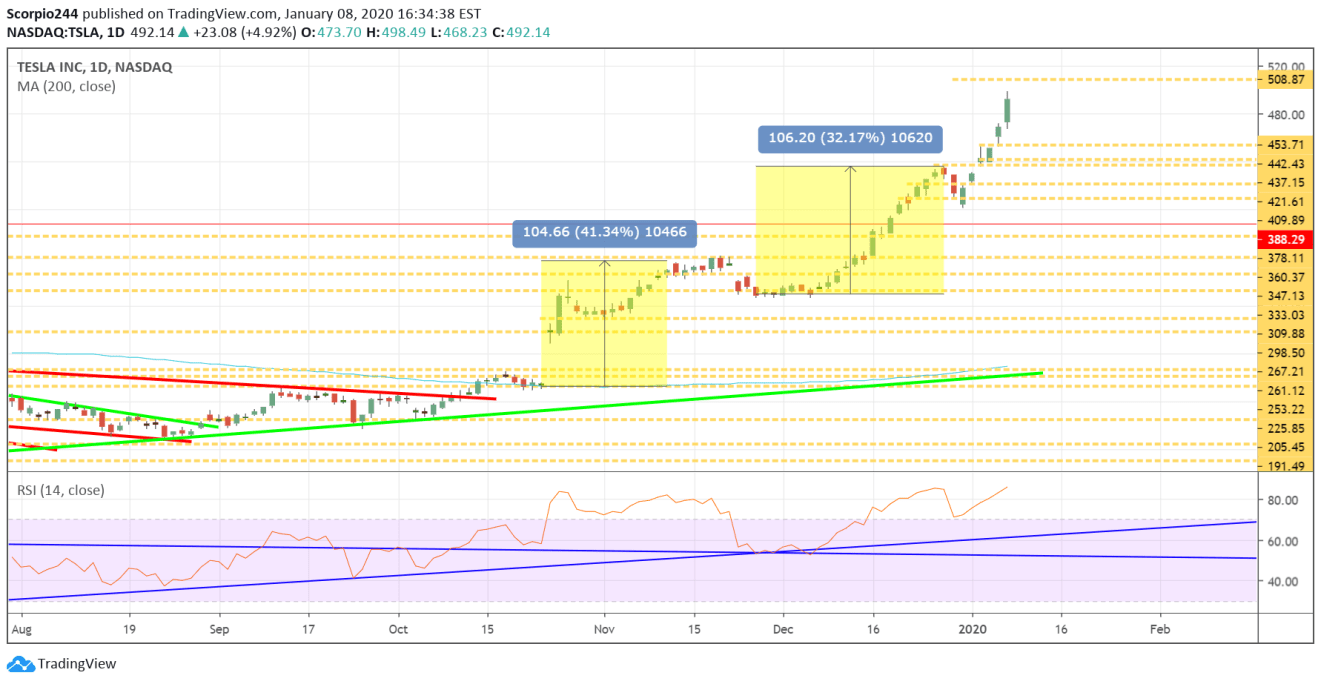
The stock got as high as $498 yesterday, and pretty close to the $508 technical target I laid out over the weekend.
Square (SQ)
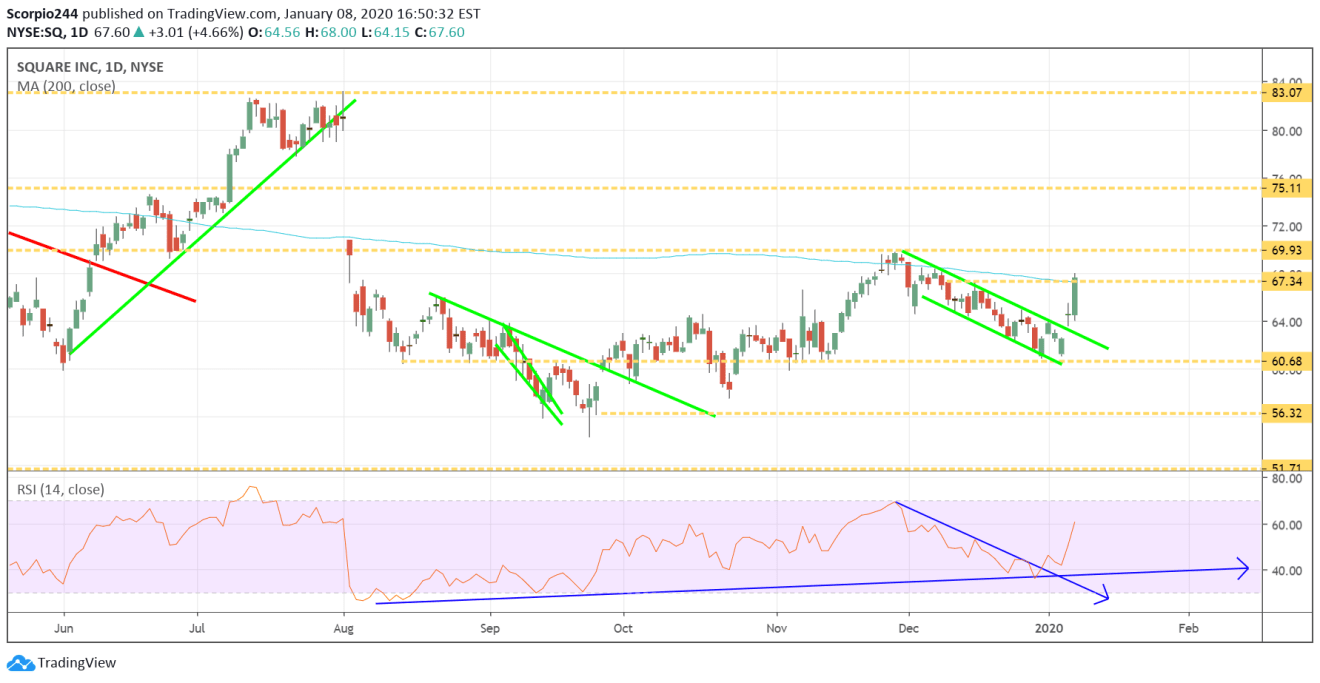
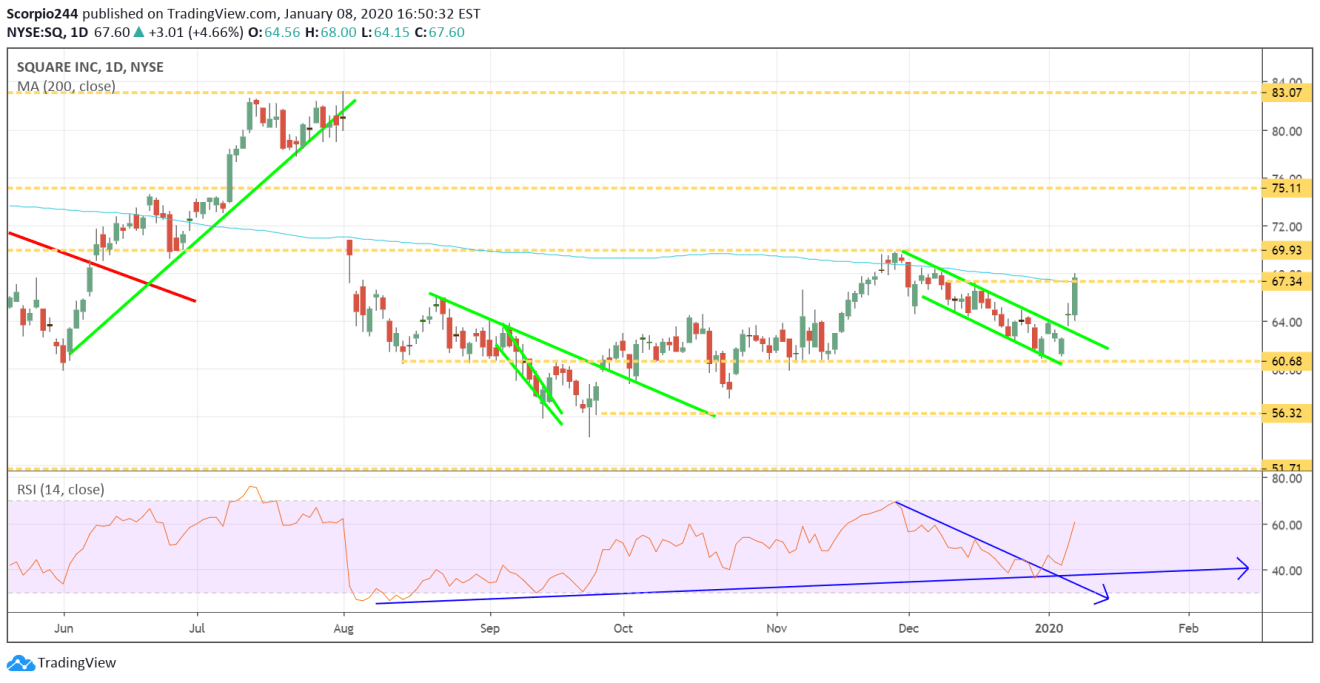
Square (NYSE:SQ) continues to rip higher, and those options traders have to be feeling good about themselves at this point. It looks like $70 is the next level potentially for the stock.
Roku (ROKU)
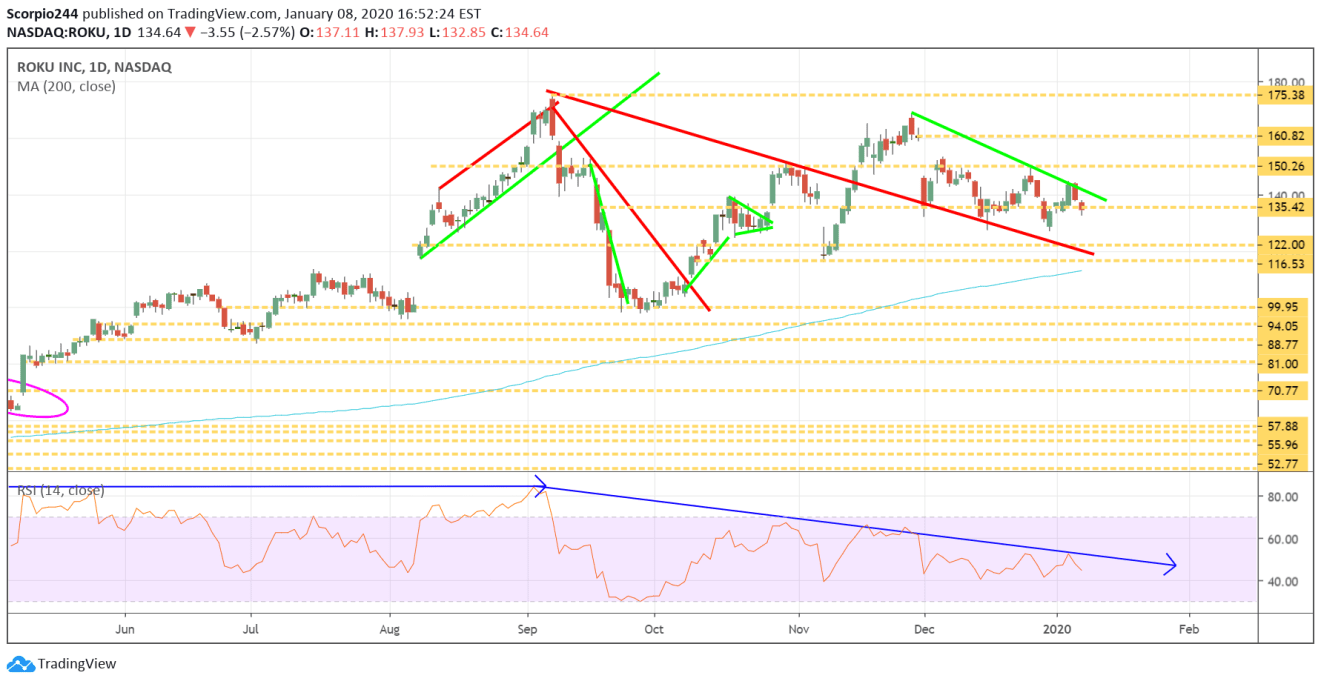
Well, Roku (NASDAQ:ROKU) seems to be going according to plan this week, that’s good. It probably means the stock goes to $127.
Uber (UBER)
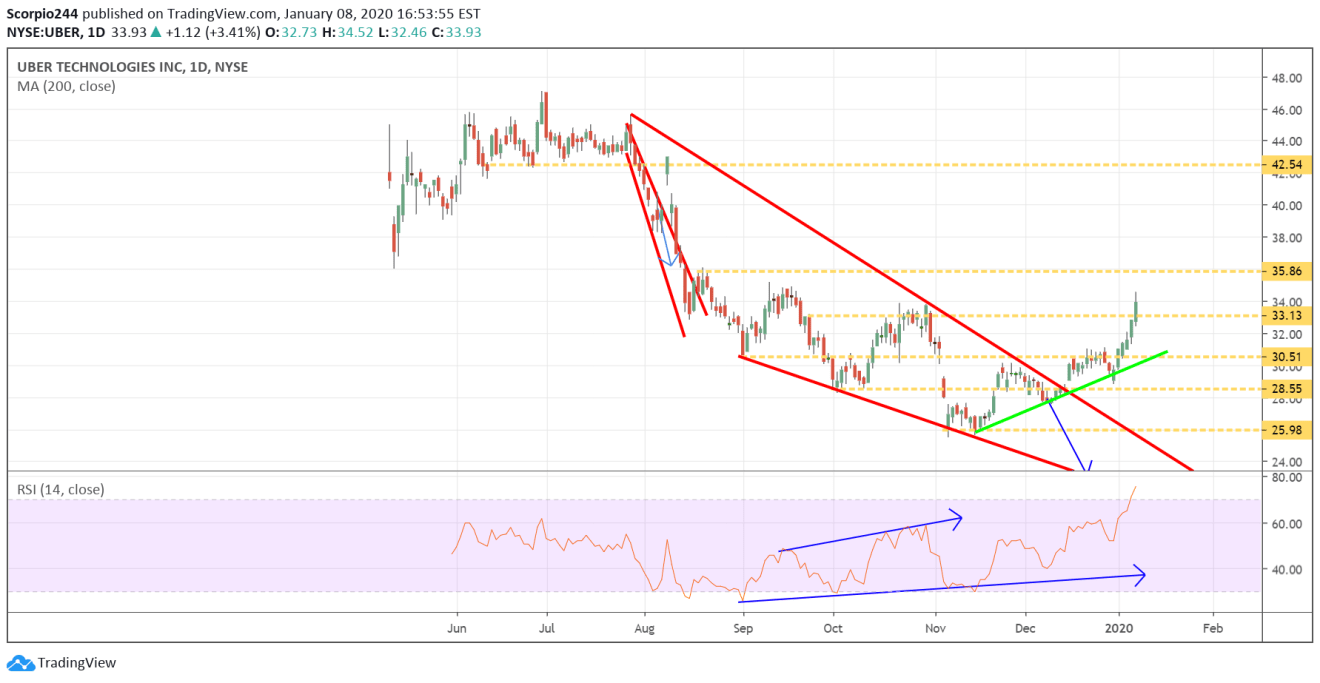
Uber (NYSE:UBER) is finally starting to come back to life, rising above $33.15, and now it may be on its way to $35.90. It looks like the falling wedge pattern is now in full effect.
Netflix (NFLX)
Should we talk about Netflix (NASDAQ:NFLX)? Ok, fine. I mentioned it yesterday in the mid-day update, noting the stock was challenging resistance at $336. It finally broke out and climbed above resistance to around $339. The RSI and the push above resistance make me think the stock can now work to fill that gap up to $362. How many times have I said that before.
